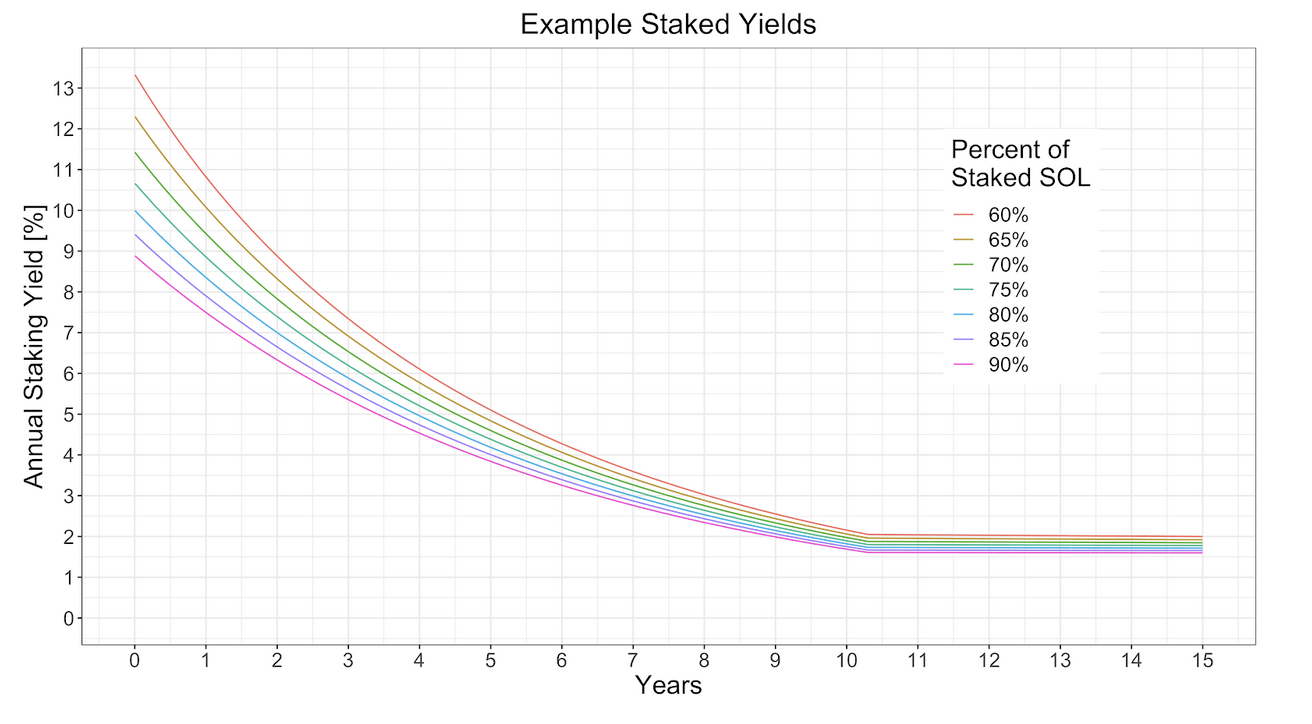
SOL provides this chart (https://solana.com/src/img/staking/validator2.png). It should all be straightforward; however, if you look at the following chart:
WhiI believe this represents around three years’ worth of data. Itoks like the staking yields have not much changed over the last three years, whereas yields should have declined by ~40% over three years (15% p.a.).
It is not immediately clear to me why the yields are so stable.
Thanks for helping, and I apologise for my poor English. I am interested in getting into defi and SOL, but I missed some kind of knowledge gap without a proper finance education.
submitted by /u/Accomplished-Mark771
[link] [comments]
